суббота, 21 февраля 2026 г.
World's Richest People and Families, 1988 - 2026.
понедельник, 26 февраля 2024 г.
The World’s Richest Countries
By
Niccolo ConteHow do you measure the economic success of a country?
By one classic measure, GDP per capita shows individual economic prosperity. But comparing countries simply by this metric doesn’t tell the whole story. To get a better idea of living standards, it helps to look at how far your money will go along with adjusting for labor productivity.
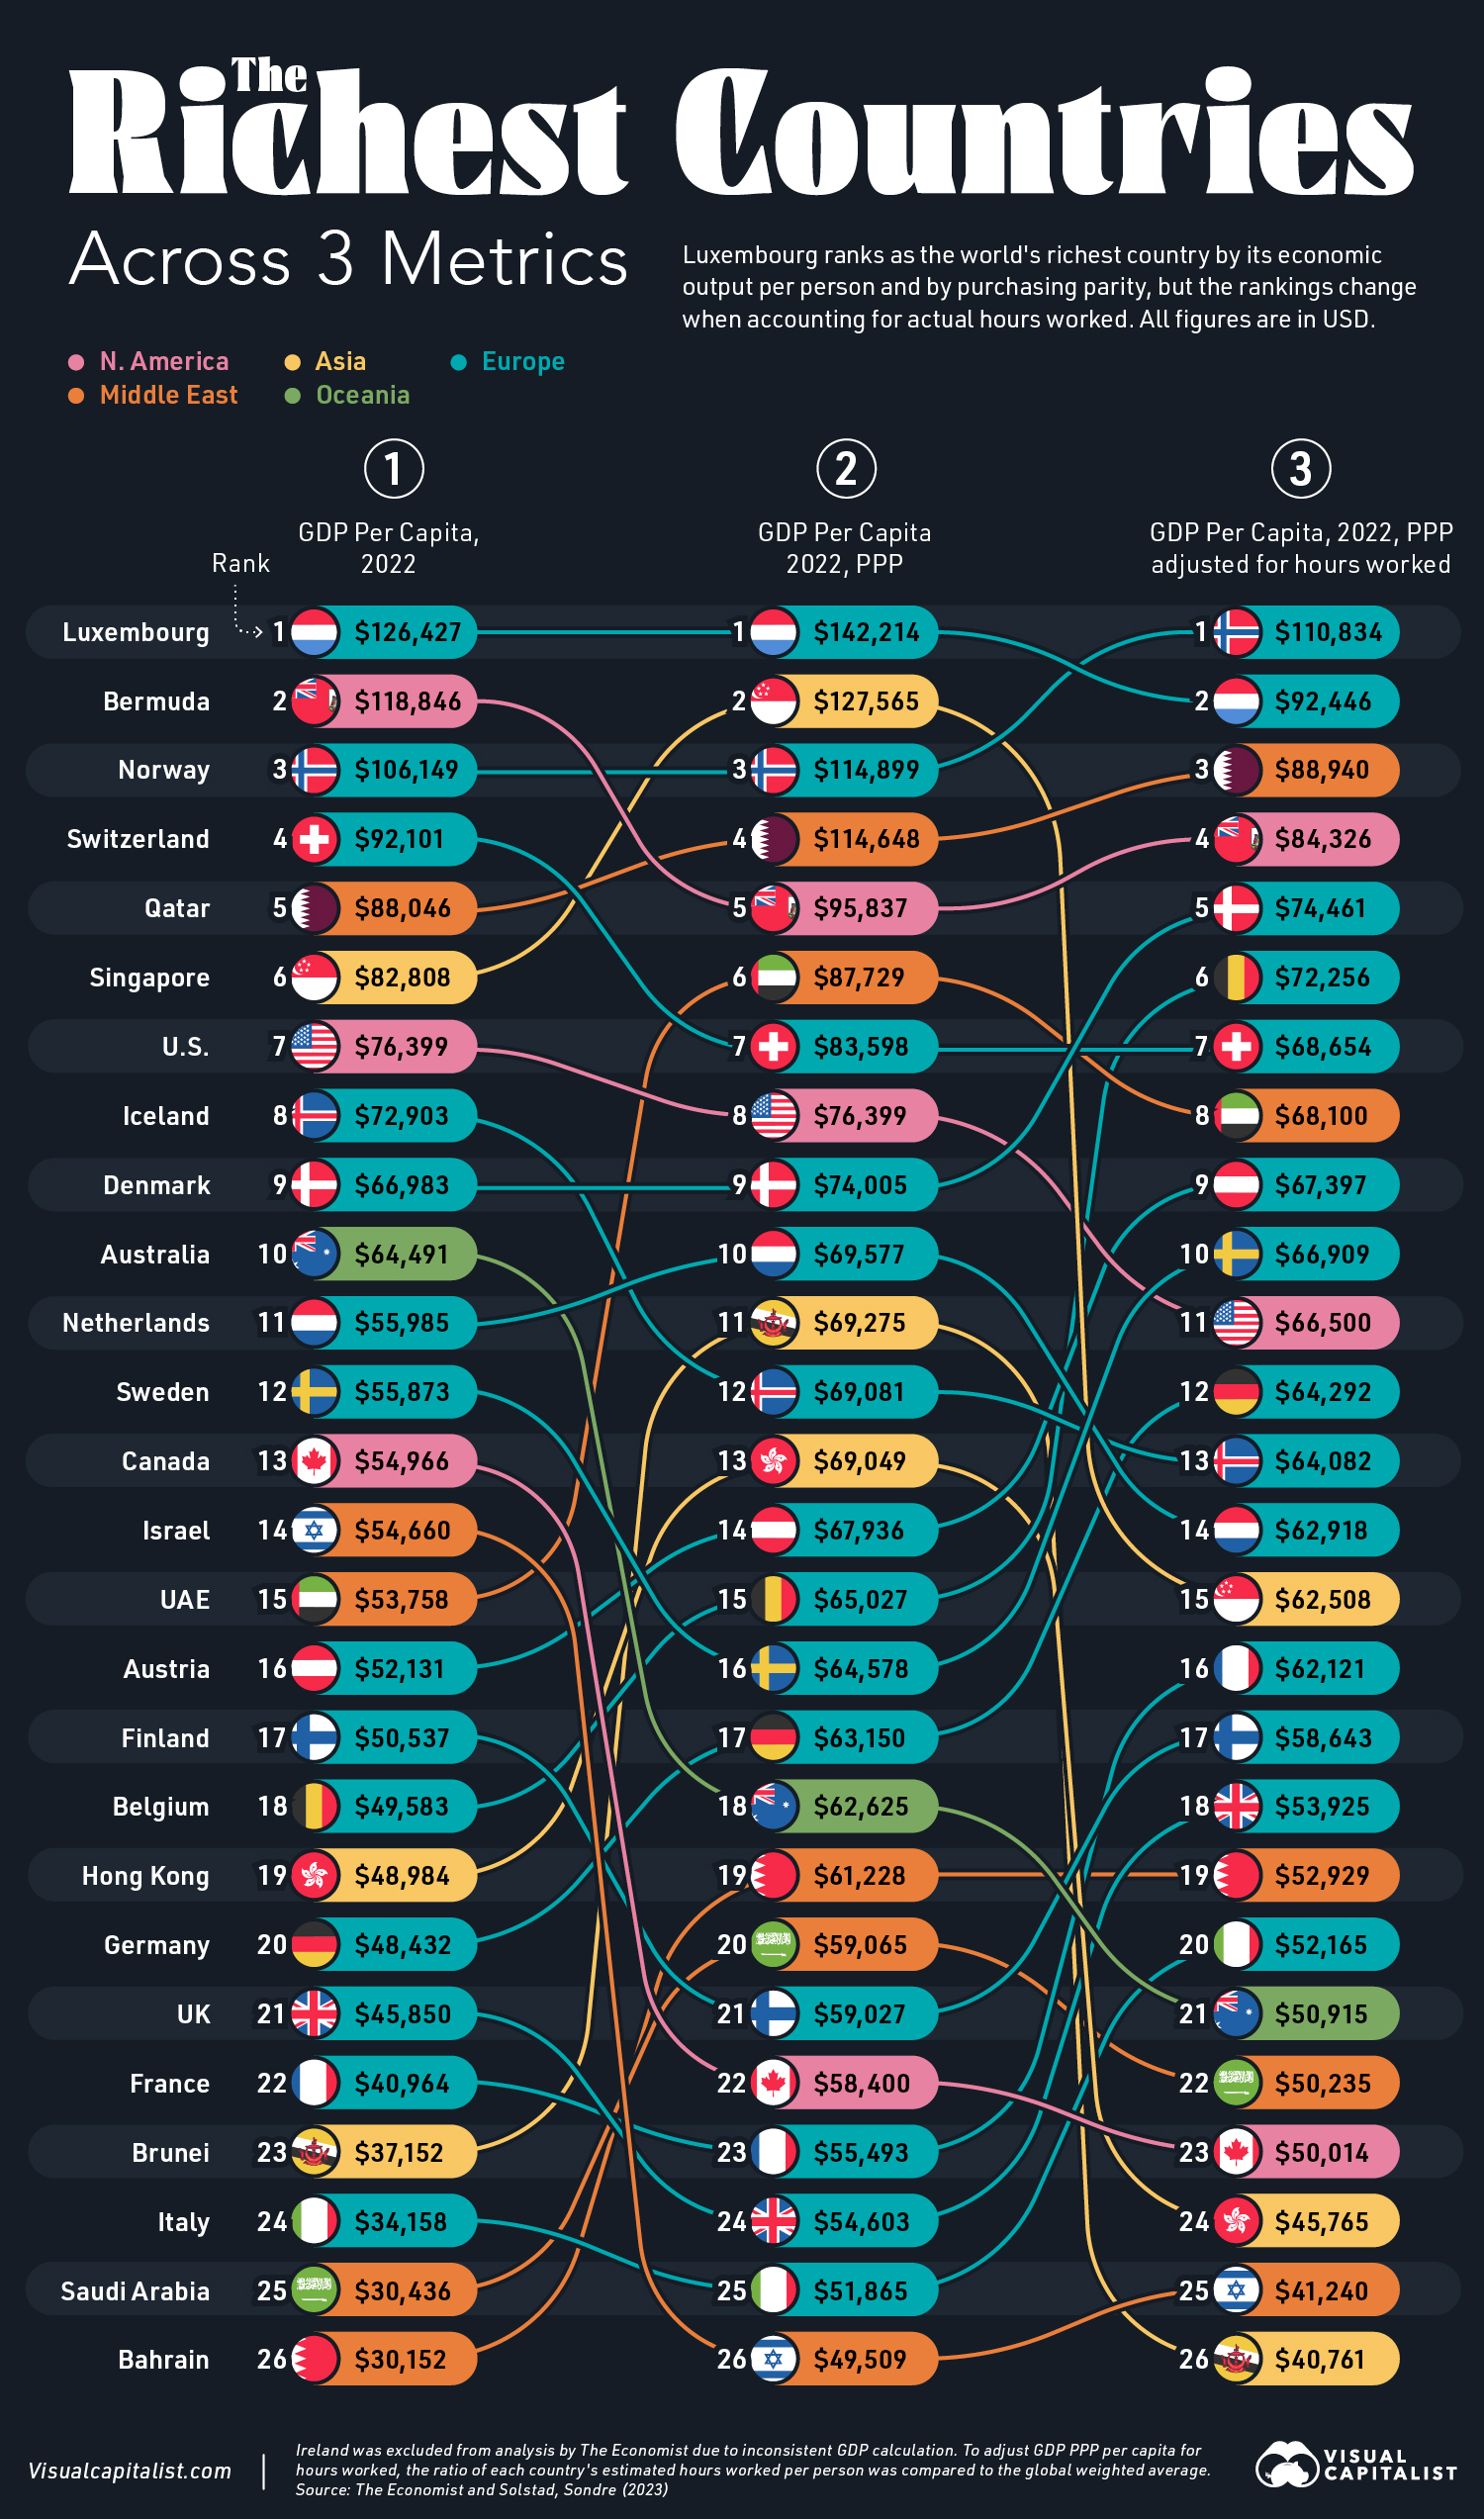
This graphic shows the world’s richest countries by three different measures, based on data from The Economist and Sondre Solstad. All figures are in U.S. dollars.
World’s Richest Countries, by GDP per Capita
As the table below shows, smaller countries fare much better—of the top 10 richest countries, eight of them have populations under 10 million people.
Luxembourg, whose financial sector makes up 25% of its GDP, is the world’s richest country by GDP per capita.
With a population of just 660,000, the country is also considered a tax haven, incentivizing foreign investment due to its favorable tax policies. Due to the small nation’s considerable wealth, its citizens enjoy free education, healthcare, and transportation.
Bermuda, like Luxembourg, is known as a tax haven. Several multinationals shelter billions in the island nation—including Google, which moved $23 billion in a shell company in 2017 to lower foreign tax costs.
With a GDP per capita of $82,808, Singapore is the richest country in Asia thanks to its role as a global hub for finance, trade, and tourism.
A New Lens: Purchasing Power Parity (PPP)
Another way to compare countries adjusts GDP per capita based on the relative price of goods and services in order to account for differences in the cost of living and local currency strength.
This provides a clearer comparison of living standards across countries since the value of a dollar can buy more goods in different countries. Below, we show how countries perform differently based on this measure, known as GDP per capita adjusted by purchasing power parity (PPP):
As we can see, Singapore significantly jumps up the ranking, when adjusting for PPP.
Looking at the world’s richest countries this way shows that living standards are high in Singapore since their currency can go further than in other countries. Often, richer countries will have higher prices as a result of higher labor productivity, advanced technology, and other factors.
Similarly, the UAE rises into the top 10, outpacing both Switzerland and America. As one of the top oil-producing countries worldwide, it made $100 billion in oil revenues in 2022, equal to about $100,000 per citizen.
World’s Richest Countries, Adjusted for Hours Worked
How do the rankings change when accounting for productivity?
To analyze this, GDP per capita on a PPP basis is adjusted by the estimated hours worked per person. Economies that have high quality, productive workforces with strong standards of living tend to rank well using this measure.
In this case, Norway has the best ranking globally. This strong showing is likely influenced by working fewer hours compared to the American population due to greater holiday allowances, among other factors.
Meanwhile, the U.S. is in 11th place when adjusting for hours worked, with mainly Western European nations ahead in the ranking. Similarly, countries including the Netherlands, Singapore, Hong Kong, and Brunei drop when adjusting for working hours.
Importantly, the world’s richest countries can’t be understood by a single measure. It’s only by looking at a range of metrics that we can see how countries vary in the rankings depending on the measure and criteria chosen.
https://bitly.ws/3ecip
среда, 14 февраля 2024 г.
среда, 26 июля 2023 г.
The Dutch East India Company, the most valuable corporation in history
The Dutch East India Company (Vereenigde Oost-Indische Compagnie, or VOC) is the most valuable corporation in history. It was founded in 1602 to trade mainly in spices and quickly became one of the most influential companies in the world.
The company had a 21-year monopoly granted by the Dutch government on many of the world’s markets and held its private army and navy.
It was indeed an incredible display of human ingenuity and organization—so much so that its voyage of 1 million voyagers to Asia puts the rest of Europe combined to shame.
Headquarters of the VOCHistory of the Dutch East India Company
In 1602, the Dutch East India Company was established with its headquarters in the Oost-Indisch Huis (East-India House) in the heart of Amsterdam.
The Dutch Republic (modern-day Netherlands) established the trading firm to safeguard Dutch commerce in the Indian Ocean and support the Dutch resistance movement against Spanish colonial rule.
Throughout the majority of the 17th century, the Dutch East India Company served as the instrumental arm of the Dutch economic empire in the East Indies (modern-day Indonesia), which it helped to build and expand until its eventual dissolution.
The Dutch government granted the company a monopoly on trade in the waters between the southern tip of Africa (Cape of Good Hope) and the Straits of Magellan (connecting the Atlantic and Pacific Oceans), as well as the authority to make treaties with local princes, construct forts and maintain armies, and carry out administrative duties using officials who were sworn to loyalty to the Dutch government.
The company was able to expel the Portuguese from the East Indies and destroy the British navy thanks to the leadership of tenacious governors-general like Jan Pieterszoon Coen (1618-23) and Anthony van Diemen (1636-45).
The corporation was also the first legitimate company to issue stocks, which peaked during the Dutch “Tulip Mania,” a passion for tulip bulbs that is regarded as the world’s first major financial bubble. It even had 70,000 workers at one time, a remarkable feat for a business founded more than 400 years ago.
During their century of dominance, VOC had a massive international reach. Its ability to command fleets capable of repelling navy attacks and seizing territory is remarkable for a privately owned firm.
It was the VOC that gave rise to the concept of globalism. Europeans desired Asian spices and textiles, but Asia had few needs that Europeans could satisfy. In exchange, however, Asia was interested in the precious metals that Portugal and Spain had in great quantity.
In 1619, the corporation renamed Jacatra Batavia (present-day Jakarta) and used it as a springboard to conquer Java and the surrounding islands. The company’s influence in Java’s politics and commerce became increasingly prominent as the 17th century progressed.
Around the turn of the 18th century, the firm shifted from being a commercial maritime concern to a more loosely organized territorial group focused on the agricultural products of the Indonesian archipelago.
By the close of the 18th century, the business was deeply in debt and plagued by corruption. In 1799, the Dutch government canceled the business’s charter and assumed responsibility for the debts and assets of the corporation.
Why the VOC is the most valuable corporation in history
Let’s look at how this company dominated the world markets for around 200 years.
Established Monopolies
The Dutch East India Company monopolized many markets, including coffee, tea, tobacco, silk, porcelain, spices, and saltpeter.
This allowed them to dictate prices and reap huge profits from their trading activities. In addition to obtaining monopolies on these products, they also created a system of trade that was highly efficient and allowed them to move goods quickly between countries with minimal losses.
Military Power
The VOC established its own private military force to protect its interests from pirates or other competitors. This included a land army and a fleet of ships equipped with cannons and other weapons.
This private military force successfully protected VOC interests and allowed them to expand their trading networks further.
Financial System Innovations
The VOC also developed innovative financial systems that helped them manage their wealth more effectively. They were among the first companies to issue stocks and bonds, allowing them to raise capital quickly while maintaining control over their finances.
Additionally, they could use derivatives such as futures contracts to hedge against price fluctuations in specific markets.
How do Modern-day companies compare to The Dutch East India Company?
Today’s businesses have evolved into a massive and dynamic global network thanks to technological advancements, communication, shipping, and investment capabilities.
Where The Dutch East India Company relied on physical resources such as ships to transfer goods from its many geopolitical ports, modern companies are not limited by physical distance or resources; instead, they can easily take advantage of digital technologies for global collaborations that span vast distances and even entire hemispheres.
By capitalizing on modern technologies like cloud computing and robotics, today’s companies can work faster and more efficiently than ever!
Still, it’s impressive that in the 1600s, the Dutch East India Company made it to 78 million guilders, which translates to $7.9 trillion in current dollars today. To put things clearly, adding the market caps of 20 of the world’s largest companies, including Apple, Microsoft, and Amazon, gets us to $7.9 trillion.
The dark side of The Dutch East India Company
The Dutch East India Company (VOC) hugely impacted the global economy and trading during its mercantile period from 1602 to 1798. Establishing trade routes and creating monopolies, the VOC contributed to global feats of exploration and scientific discovery.
However, not all was rosy in this company’s lifespan – reports tell tales of brutality, torture, and slavery among its practices. Tales undoubtedly made the boardroom a bit tenser when it came time to talk sales forecasts! The truth is that all companies have their dark side, but some are darker than others.
The VOC was incredibly profitable and had a remarkable influence on world history. At the same time, they displayed ruthless behavior as they competed with other European companies for control of lucrative trading colonies. Today, we can look back at this powerful company and learn from its story’s light and dark sides.
The Most Valuable Company Of All Time
The Dutch East India Company dominated world markets for over two centuries due to its ability to obtain monopolies on certain products, maintain its military forces, and develop innovative financial systems that allowed it to manage its wealth more effectively than any other company.
The legacy of the VOC still lives on today through modern corporations that employ similar strategies for success, like creating monopolies on specific products or services and using stocks & bonds for financing operations.
While some may argue that modern corporations have taken these tactics too far in some cases, there is no denying that without this pioneering company from long ago, we would not be where we are today regarding corporate powerhouses dominating global markets.
https://www.historydefined.net/
воскресенье, 2 июля 2023 г.
пятница, 22 октября 2021 г.
All the Metals We Mined
By
Govind BhutadaThis was originally posted on Elements. Sign up to the free mailing list to get beautiful visualizations on natural resource megatrends in your email every week.
Metals are all around us, from our phones and cars to our homes and office buildings.
While we often overlook the presence of these raw materials, they are an essential part of the modern economy. But obtaining these materials can be a complex process that involves mining, refining, and then converting them into usable forms.
So, how much metal gets mined in a year?
Metals vs Ores
Before digging into the numbers, it’s important that we distinguish between ores and metals.
Ores are naturally occurring rocks that contain metals and metal compounds. Metals are the valuable parts of ores that can be extracted by separating and removing the waste rock. As a result, ore production is typically much higher than the actual metal content of the ore. For example, miners produced 347 million tonnes of bauxite ore in 2019, but the actual aluminum metal content extracted from that was only 62.9 million tonnes.
Here are all the metals and metal ores mined in 2019, according to the British Geological Survey:
| Metal/Ore | Quantity Mined (tonnes) | % of Total |
|---|---|---|
| Iron Ore | 3,040,000,000 | 93.57% |
| Industrial Metals | 207,478,486 | 6.39% |
| Technology and Precious Metals | 1,335,848 | 0.04% |
| Total | 3,248,814,334 | 100% |
Miners produced roughly three billion tonnes of iron ore in 2019, representing close to 94% of all mined metals. The primary use of all this iron is to make steel. In fact, 98% of iron ore goes into steelmaking, with the rest fulfilling various other applications.
Industrial and technology metals made up the other 6% of all mined metals in 2019. How do they break down?
Industrial Metals
From construction and agriculture to manufacturing and transportation, virtually every industry harnesses the properties of metals in different ways.
Here are the industrial metals we mined in 2019.
| Metal | Quantity Mined (tonnes) | % of Total |
|---|---|---|
| Aluminum | 62,900,000 | 30% |
| Manganese Ore | 56,600,000 | 27% |
| Chromium Ores and Concentrates | 38,600,000 | 19% |
| Copper | 20,700,000 | 10% |
| Zinc | 12,300,000 | 6% |
| Titanium (Titanium Dioxide Content) | 6,300,000 | 3% |
| Lead | 4,700,000 | 2% |
| Nickel | 2,702,000 | 1% |
| Zirconium Minerals (Zircon) | 1,337,000 | 1% |
| Magnesium | 1,059,736 | 1% |
| Total | 207,478,486 | 100% |
Percentages may not add up to 100 due to rounding.
It’s no surprise that aluminum is the most-produced industrial metal. The lightweight metal is one of the most commonly used materials in the world, with uses ranging from making foils and beer kegs to buildings and aircraft parts.
Manganese and chromium rank second and third respectively in terms of metal mined, and are important ingredients in steelmaking. Manganese helps convert iron ore into steel, and chromium hardens and toughens steel. Furthermore, manganese is a critical ingredient of lithium-manganese-cobalt-oxide (NMC) batteries for electric vehicles.
Although copper production is around one-third that of aluminum, copper has a key role in making modern life possible. The red metal is found in virtually every wire, motor, and electrical appliance in our homes and offices. It’s also critical for various renewable energy technologies and electric vehicles.
Technology and Precious Metals
Technology is only as good as the materials that make it.
Technology metals can be classified as relatively rare metals commonly used in technology and devices. While miners produce some tech and precious metals in large quantities, others are relatively scarce.
| Metal | Quantity Mined in 2019 (tonnes) | % of Total |
|---|---|---|
| Tin | 305,000 | 23% |
| Molybdenum | 275,000 | 21% |
| Rare Earth Elements | 220,000 | 16% |
| Cobalt | 123,000 | 9% |
| Lithium | 97,500 | 7% |
| Tungsten | 91,500 | 7% |
| Vanadium | 81,000 | 6% |
| Niobium | 57,000 | 4% |
| Cadmium | 27,500 | 2% |
| Tantalum | 27,000 | 2% |
| Total | 1,335,848 | 100.00% |
Percentages may not add up to 100 due to rounding.
Tin was the most-mined tech metal in 2019, and according to the International Tin Association, nearly half of it went into soldering.
It’s also interesting to see the prevalence of battery and energy metals. Lithium, cobalt, vanadium, and molybdenum are all critical for various energy technologies, including lithium-ion batteries, wind farms, and energy storage technologies. Additionally, miners also extracted 220,000 tonnes of rare earth elements, of which 60% came from China.
Given their rarity, it’s not surprising that gold, silver, and platinum group metals (PGMs) were the least-mined materials in this category. Collectively, these metals represent just 2.3% of the tech and precious metals mined in 2019.
A Material World
Although humans mine and use massive quantities of metals every year, it’s important to put these figures into perspective.
According to Circle Economy, the world consumes 100.6 billion tonnes of materials annually. Of this total, 3.2 billion tonnes of metals produced in 2019 would account for just 3% of our overall material consumption. In fact, the world’s annual production of cement alone is around 4.1 billion tonnes, dwarfing total metal production.
The world’s appetite for materials is growing with its population. As resource-intensive megatrends such as urbanization and electrification pick up the pace, our material pie will only get larger.
https://bit.ly/3B2hdON